MLOps Observability & Monitoring

You can learn the key ideas behind observability in context of ML

Course #7 of MLOps Specialization · Coming Soon

ML systems don’t fail loudly. They degrade quietly – a prediction score that drifts by 3% a week, a batch pipeline that stalls without alerting, a RAG index that goes stale without anyone noticing. By the time users report problems, the damage is done. This course gives you the full observability stack for ML: the signals to collect, the dashboards to build, the alerts to configure, and the on-call playbook to follow when something breaks.

  • Instrument online serving and batch pipelines with ML-specific metrics, structured logs, and distributed traces
  • Build drift detection jobs and online evaluation feedback loops that act before users notice
  • Publish Grafana dashboards covering service health, model quality, data freshness, and SLO error budgets
  • Configure multi-stage alerts with routing, deduplication, and runbook links for ML on-call
  • Apply observability to LLM/GenAI workloads – quality proxies, RAG freshness, and token cost monitoring
Join Waitlist – Get Early Access Be first in line · Subscriber pricing at launch
📡
16 Content ModulesMetrics · Logs · Traces · Alerts
🛠️
10 Hands-on Labs3 Post-Mortems
🏁
Capstone ProjectChurn API + LLM/RAG endpoint
📊
Prometheus · Grafana · OpenTelemetry
🔭
Classical ML + LLM/GenAICourse #7 · Coming Soon

Sound familiar?

Your ML system is running. But you’re not sure it’s working.

Infrastructure monitoring tells you whether your servers are up. It doesn’t tell you whether your model’s predictions are drifting, whether the features feeding it are stale, or whether a silent schema change upstream has been corrupting your outputs for the past two weeks. ML observability is a different discipline, and most MLOps engineers have never had to build it from scratch.

🔕
“Our model accuracy dropped 8% last month. Nobody noticed until the business review.”
Latency and error rate alerts don’t catch model quality degradation. Drift monitoring, online evaluation feedback loops, and prediction distribution tracking are what catch it, and they require separate instrumentation that most teams never build until they’ve been burned once.
🗺️
“When a model incident happens, we spend hours trying to figure out where it started.”
Without request tracing from feature retrieval through model inference through downstream services, and without correlated logs carrying model_version and dataset_ref, debugging an ML incident is archaeology. Distributed tracing with ML context turns hours of investigation into minutes.
📊
“We have dashboards for infrastructure but nothing that tells us about model health.”
Service dashboards show CPU and memory. ML systems need a second tier: prediction score distributions, drift rate over time, data freshness signals, and SLO error budget burn. Without these, model health is invisible to everyone — on-call engineers, stakeholders, and the team itself.
This course was built to solve exactly that. MLOps Observability & Monitoring gives you the complete observability stack — from the first metric label to the last Grafana dashboard — so your team knows what’s happening in its ML systems in real time, and knows what to do when something goes wrong.

What makes this different

Not infrastructure monitoring applied to ML.
Observability designed for what ML systems actually are.

Standard observability courses teach you to monitor services. ML systems need more: prediction quality signals, data freshness checks, drift detectors, and feedback loops that close the gap between deployment and ground truth. This course teaches the ML observability layer that sits on top of standard infrastructure monitoring — and integrates with it.

✓

ML-specific signal design — the layer infrastructure monitoring misses

The course starts with telemetry design: labelling metrics with model_name, model_version, and dataset_version; propagating request and correlation IDs across ML services; avoiding cardinality traps. These design decisions determine whether your observability data is useful or overwhelming.

✓

SLOs defined at the model layer, not just the service layer

Standard SLOs cover latency and error rate. ML SLOs cover prediction quality proxy, drift rate, and data freshness — metrics that require ML-specific instrumentation. The SLIs/SLOs module teaches you to define, document, and link these to runbooks, so your on-call process is grounded in ML-meaningful thresholds.

✓

Full three-pillar stack: metrics, logs, and distributed traces — all with ML context

Separate modules for instrumenting serving, instrumenting batch pipelines, building structured JSON logs with model references, and adding OpenTelemetry traces with spans across feature retrieval → model → downstream. You build all three pillars, not just dashboards over a single signal type.

✓

Grafana dashboards for four distinct views: service, model, data, and SLO

The dashboards module builds four separate views — service health, model quality and drift, data freshness and completeness, and SLO error budget burn. You publish them with saved views so the right dashboard is in front of the right person during an incident.

✓

LLM/GenAI observability as a dedicated module

LLM observability is genuinely different: quality proxy instead of accuracy, refusal/toxicity rate instead of precision, RAG index freshness instead of data freshness, token count as a cost and quality signal. The LLM module covers all of this with a hands-on lab adding LLM metrics and a RAG freshness tile.

✓

Three post-mortems based on realistic production incidents

The case studies module works through three realistic ML incidents — silent feature break from an upstream schema change, concept drift after a promotional campaign, and an LLM RAG index going stale. For each: the detection story, the diagnosis, and the action. You write a structured post-mortem as the module deliverable.

❌ Infrastructure observability courses

—Monitor CPU, memory, latency, and error rate
—No model quality signals, no drift detection
—Traces cover service calls, not ML-specific spans
—No feedback loops, no ground truth capture, no eval cards

✓ MLOps Observability & Monitoring

→ML-specific SLIs alongside standard service SLIs
→Drift jobs, prediction distribution tracking, quality proxies
→Spans cover feature retrieval → model → downstream with context
→Online evaluation feedback loops and weekly eval cards

Learning outcomes

By the end of this course, you’ll be able to:

Six observability capabilities that give your team real-time visibility into every layer of a production ML system — from service health to model quality to LLM RAG freshness.

🔧 Instrumentation
✓
Instrument online serving and batch pipelines with ML-specific metrics — prediction distributions, drift signals, freshness markers, and cost hints
Add the metrics that standard infrastructure monitoring misses: score histograms, class ratios, confidence bands, batch freshness, consumer lag, and feature staleness — all labelled with model and dataset version.
📈 Drift & Eval Loops
✓
Build drift detection jobs and online evaluation feedback loops that catch model degradation before users notice — and drive retrain or rollback decisions
Run PSI and KS tests against baseline windows, capture delayed ground truth safely from production queues, compute rolling AUC/PR metrics, and publish weekly eval cards with champion/challenger tracking.
🔎 Traces & Logs
✓
Implement distributed request tracing and structured JSON logging — so every ML incident can be diagnosed in minutes, not hours
Add OpenTelemetry spans across feature retrieval, model inference, and downstream services. Ship structured logs with model_version, dataset_ref, and request_id so every log line is traceable to a specific model version and data state.
📊 Dashboards
✓
Publish four Grafana dashboards — service health, model quality and drift, data freshness, and SLO error budget burn — with saved views for on-call use
Build the four dashboards that production ML teams need: one showing whether the service is up, one showing whether the model is performing, one showing whether the data is fresh, and one showing whether you’re burning your error budget.
🚨 Alerts & On-Call
✓
Configure multi-stage ML alerts with routing, deduplication, and runbook links — and write structured post-mortems after ML incidents
Set up page-on-SLO-breach vs. ticket-on-warning routing, avoid flapping alerts with correct thresholds, and practice the post-mortem format against three realistic ML production incidents.
🤖 LLM Observability
✓
Apply observability to LLM and GenAI workloads — quality proxies, refusal/toxicity rates, token counts, and RAG index freshness monitoring
Instrument the LLM/RAG endpoint in the running project: track LLM-specific SLIs, add a RAG freshness tile showing index age and chunk coverage, and compare offline eval sets against online quality probes.

What you’ll learn

Course Curriculum

16 Content Modules
10 Hands-on Labs
3 Post-Mortems
1 Capstone Project
#7 Specialization
🗺️01
Introduction 6 lessonsProject · scope · setup
+
  • 📹 Course Introduction
  • 📹 About Your Instructor
  • 📹 Course Structure
  • 📹 Churn API + Batch Scoring + LLM/RAG Endpoint — Running Project
  • 📹 What This Course Covers (and What It Does Not)
  • 📹 GitHub Repositories
🔭02
Observability in ML: Goals, Signals, Scope 4 lessonsFoundations & mental model
+
  • 📹 Why ML Systems Fail in Production — Data, Model, Service
  • 📹 Observability vs. Monitoring — Where MLOps Is Different
  • 📹 Three Pillars for ML — Metrics, Logs, Traces with Model/Data Context
  • 📹 Golden Signals + ML Signals — Quality, Drift, Freshness
🎯03
SLIs, SLOs, and SLAs for ML Services 4 lessonsML-specific reliability targets
+
  • 📹 Define SLIs for Model APIs — Latency, Error Rate, Throughput
  • 📹 Define ML SLIs — Prediction Quality Proxy, Drift Rate, Data Freshness
  • 📹 Set SLOs with Simple Thresholds and Error Budgets
  • 📹 Document SLOs and Link to Runbooks
🏷️04
Telemetry Design for ML 4 lessonsLabels · IDs · cardinality · PII
+
  • 📹 Labels/Tags for model_name, model_version, dataset_version
  • 📹 Request IDs and Correlation IDs Across Services
  • 📹 PII-Safe Logging and Redaction Basics
  • 📹 Cardinality Traps and Safe Naming Patterns
⚡05
Instrumenting Online Model Serving 4 lessons🛠️ Includes hands-on lab
+
  • 📹 Add HTTP/Server Metrics — Latency Buckets, Status Codes, Timeouts
  • 📹 Custom Model Metrics — Request Count, Queue Time, Cold Starts, Cache Hits
  • 📹 Prediction Metrics — Score Histograms, Class Ratios, Confidence Bands
  • 📹 Health Checks (Readiness/Liveness) and Dependency Checks
  • 🛠️ Instrument a FastAPI/KServe Service with Model/Version Labels — Hands-on Lab
🔄06
Instrumenting Batch & Streaming Pipelines 3 lessons🛠️ Includes hands-on lab
+
  • 📹 Batch Pipeline Metrics — Freshness, Completeness, Success Ratio, Duration
  • 📹 Streaming — Consumer Lag, Partition Skew, Dead-Letter Queue Counts
  • 📹 Emit Feature Freshness and Backfill Markers
  • 🛠️ Add Pipeline Metrics and a Daily Freshness Report — Hands-on Lab
📉07
Data Quality & Drift Monitoring 4 lessons🛠️ Includes hands-on lab
+
  • 📹 Types of Drift — Covariate, Prior, Concept
  • 📹 Simple Detectors — PSI, KS Test, Population Shift Checks
  • 📹 Seasonality and Baseline Windows — How to Avoid False Alarms
  • 📹 From Detection to Action — Silence, Retrain, Rollback
  • 🛠️ Build a Drift Job that Writes Alerts + a Weekly Drift Report — Hands-on Lab
🔁08
Online Evaluation & Feedback Loops 3 lessons🛠️ Includes hands-on lab
+
  • 📹 Capture Ground Truth Safely — Delayed Labels, Queues
  • 📹 Rolling Metrics — AUC/PR, Calibration on Recent Windows
  • 📹 Champion/Challenger Tracking in Production
  • 🛠️ Log Predictions + Labels and Publish a Weekly Eval Card — Hands-on Lab
🕸️09
Tracing ML Requests End-to-End 3 lessons🛠️ Includes hands-on lab
+
  • 📹 Traces and Spans — Feature Retrieval → Model → Downstream
  • 📹 Propagate Context IDs Across Calls
  • 📹 Sampling Strategies that Keep Cost Low
  • 🛠️ Add OpenTelemetry Traces and View a Request Waterfall — Hands-on Lab
📋10
Logging for ML Systems 3 lessons🛠️ Includes hands-on lab
+
  • 📹 JSON Logs with model_version, dataset_ref, request_id
  • 📹 Log Levels and Rate Limiting
  • 📹 Redaction and Safe Error Details
  • 🛠️ Ship Structured Logs and Build a Quick Search View — Hands-on Lab
📊11
Dashboards that Drive Action 4 lessons🛠️ Includes hands-on lab
+
  • 📹 Service Dashboard — Latency, Error Rate, Throughput
  • 📹 Model Dashboard — Quality Proxies, Drift Tiles, Version Adoption
  • 📹 Data Dashboard — Freshness, Completeness, Schema Change Rate
  • 📹 SLO Dashboard + Error Budget Burn
  • 🛠️ Publish Three Grafana Dashboards with Saved Views — Hands-on Lab
🚨12
Alerts & On-Call for ML 3 lessons🛠️ Includes hands-on lab
+
  • 📹 Multi-Stage Alerts — Page on SLO Breach, Ticket on Warnings
  • 📹 Deduplication and Routing — Teams, Schedules
  • 📹 Alert Hygiene — Test Alerts, Avoid Flapping, Add Runbook Links
  • 🛠️ Configure Alerts for Latency Spike, Drift Spike, Stale Data — Hands-on Lab
⚙️13
Performance & Capacity 3 lessons🛠️ Includes hands-on lab
+
  • 📹 Track p95/p99 Latency by model_version
  • 📹 GPU Utilization, Memory, and Model Load Times
  • 📹 Simple Capacity Planning Using Recent Traffic and Headroom
  • 🛠️ Record a Load Test and Tune Batch Size/Concurrency — Hands-on Lab
💰14
Cost-Aware Observability 2 lessonsCost signals in metrics
+
  • 📹 Approximate Cost per Prediction and Cost per Batch
  • 📹 Emit Cost Hints — GPU Hours, Storage Reads — to Metrics
🔒15
Security Signals 2 lessonsAccess logs · model abuse patterns
+
  • 📹 Access Logs, Auth Failures, Request Anomalies
  • 📹 Model Abuse Patterns — Prompt Abuse for LLMs, Request Floods
🤖16
LLM & GenAI Observability 3 lessons🛠️ Includes hands-on lab
+
  • 📹 LLM SLIs — Latency, Quality Proxy, Refusal/Toxicity Rate, Token Counts
  • 📹 RAG Freshness — Index Age, Chunk Coverage, Hit Ratio
  • 📹 Offline Eval Sets vs. Online Probes — Feedback Collection
  • 🛠️ Add LLM Metrics + a RAG Freshness Tile to Grafana — Hands-on Lab
🗂️17
Case Studies & Post-Mortems 3 incidentsSchema break · drift · RAG staleness
+
  • 📋 Schema Change Upstream — Silent Feature Break → Detection → Rollback
  • 📋 Concept Drift After Promo — Quality Drop → Challenger Promoted
  • 📋 LLM RAG Staleness — Index Not Refreshed → Fix with Scheduled Rebuild
  • ✍️ Write a Short Post-Mortem and Action Items
🏁
Capstone Project with Instructor Review
Apply the full observability stack to the Churn API + LLM/RAG endpoint — designing and implementing the SLO framework, dashboards, alerts, and post-mortem process for a complete ML system. Reviewed by Alex with personal feedback.
Included

Is this course right for you?

Built for engineers who need to know what their ML systems are doing in production — right now

You don’t need to be a data scientist. You need to be the person who knows whether the model is working, why it might not be, and what to do about it at 2am when the page fires.

⚙️
MLOps & DevOps Engineers
Own ML system health, not just service health
You already monitor services. This course extends that to the ML layer — prediction quality signals, drift alerts, data freshness dashboards, and structured post-mortems specific to model incidents. When something breaks, you’ll know exactly where to look.
→ The instrumentation, dashboards, and alerts modules directly extend the monitoring you already do into the ML-specific signals your team is missing.
🖥️
Platform & SRE Engineers
Design observability infrastructure that supports ML
Telemetry design decisions — label schemas, cardinality limits, correlation ID propagation, sampling strategies — are platform engineering decisions. Getting them right for ML systems requires understanding what signals ML teams actually need. This course teaches the ML observability requirements your platform must support.
→ The telemetry design, tracing, and SLO modules give you the ML-specific context to design observability infrastructure that doesn’t force ML teams to work around it.
💻
Software Engineers in ML teams
Instrument the models and pipelines you build
You write the serving code and batch pipelines. This course teaches you to instrument them correctly from the start — adding the prediction metrics, correlation IDs, and structured logs that make your services observable, not just running.
→ The instrumentation labs (Modules 5 and 6) produce working instrumented services you can adapt directly in your own codebase.
📋
Technical Leads & ML Engineering Managers
Define ML reliability standards for your team
SLO definitions, alert routing policies, post-mortem formats, and escalation runbooks — the observability practices in this course are the engineering standards your team runs on. This course gives you the ML-specific vocabulary and framework to define those standards explicitly.
→ The SLI/SLO module and case studies map directly to the on-call standards and incident response processes you need to establish for your ML team.

Prerequisites — what you need before starting:

✓ You need
✓ MLOps Fundamentals (Course #1) — field context
✓ Python for MLOps (Course #2) — for lab instrumentation code
✓ Basic understanding of ML serving (REST APIs, batch jobs)
✓ Familiarity with Docker and basic Linux terminal
✗ You do NOT need
✗ Prior Prometheus or Grafana experience
✗ OpenTelemetry or distributed tracing experience
✗ Data science or ML model training background
✗ Experience with LLMs or RAG architectures

MLOps Specialization path

This is Course #1 of the full
MLOps Specialization

Each course builds on the previous one. Start here to get your field overview – then go as deep as your career requires.

1
Available now
MLOps Fundamentals
Full-field observability: AI/ML landscape, model lifecycle, CI/CD, infrastructure, monitoring, security, cost, and career paths – with real examples and a GitHub project.
2
Available now
Python for MLOps
Practical Python skills for MLOps contexts – scripting pipelines, working with APIs, handling data, and automating ML workflows. No data science prerequisites
3
Available now
Machine Learning Algorithms for MLOps
The most widely used ML algorithms explained for engineers who operate them, not develop them – behavior in production, resource footprint, and deployment characteristics for each model type.
4
Coming soon
Machine Learning Model Lifecycle
From experiment tracking to production monitoring – MLflow, model registry, serving patterns, drift detection, retraining, and rollback runbooks. 9 hands-on labs on the Customer Churn Prediction project.
5
Coming soon
CI/CD for MLOps
Build ML pipelines from scratch: data CI, training CI, model packaging, container builds, registry promotion, deployment pipelines, safe rollouts, and LLM CI/CD – validated against 1k+ real job descriptions.
6
Coming soon
Data for MLOps
Data pipelines, quality contracts, versioning, lineage tracking, and feature stores – the data infrastructure layer that makes ML models reliable in production.
7
▶ This course · Coming Soon
MLOps Observability & Monitoring Coming Soon
Production monitoring for ML systems: model performance dashboards, drift detection, alerting strategies, SLOs for ML services, and incident response for model failures.
8
Coming soon
MLOps Security & Compliance
Supply chain security for ML systems, model governance, access control, compliance frameworks, and SecOps practices applied to ML infrastructure and pipelines.
🎓
Specialization goal
MLOps Specialization Certificate
Nubes Academy is developing university accreditation partnerships. The specialization is designed to qualify as a recognized credential – not just another online certificate.

Start with MLOps Fundamentals and decide your next step based on your career goals.

Start with Course #1 – Enroll Now

Coming soon

Be first when MLOps Observability & Monitoring launches

Join the waitlist to secure subscriber pricing and get notified the moment the course goes live. Everything planned, confirmed from the curriculum draft:

  • 📡
    16 content modules — full observability stack From SLO definition and telemetry design through dashboards, alerts, LLM observability, and post-mortems.
  • 🛠️
    10 hands-on labs — one per instrumentation topic Instrument FastAPI/KServe, build drift jobs, add OpenTelemetry traces, publish Grafana dashboards, configure ML alerts.
  • 📋
    3 post-mortems — realistic ML production incidents Schema break, concept drift, and LLM RAG staleness — write a structured post-mortem for each.
  • 🏆
    Certificate of Completion Step 7 of the MLOps Specialization credential path.
MLOps Observability & Monitoring · Course #7
Price: coming soon
💡 Waitlist members receive subscriber pricing — a discount off the public launch price. No commitment required.
Join the Waitlist — Free
No commitment · Just first access and subscriber pricing
  • ✓ 16 content modules confirmed
  • ✓ 10 hands-on labs
  • ✓ 3 post-mortems
  • ✓ Capstone + instructor review
  • ✓ Certificate of Completion
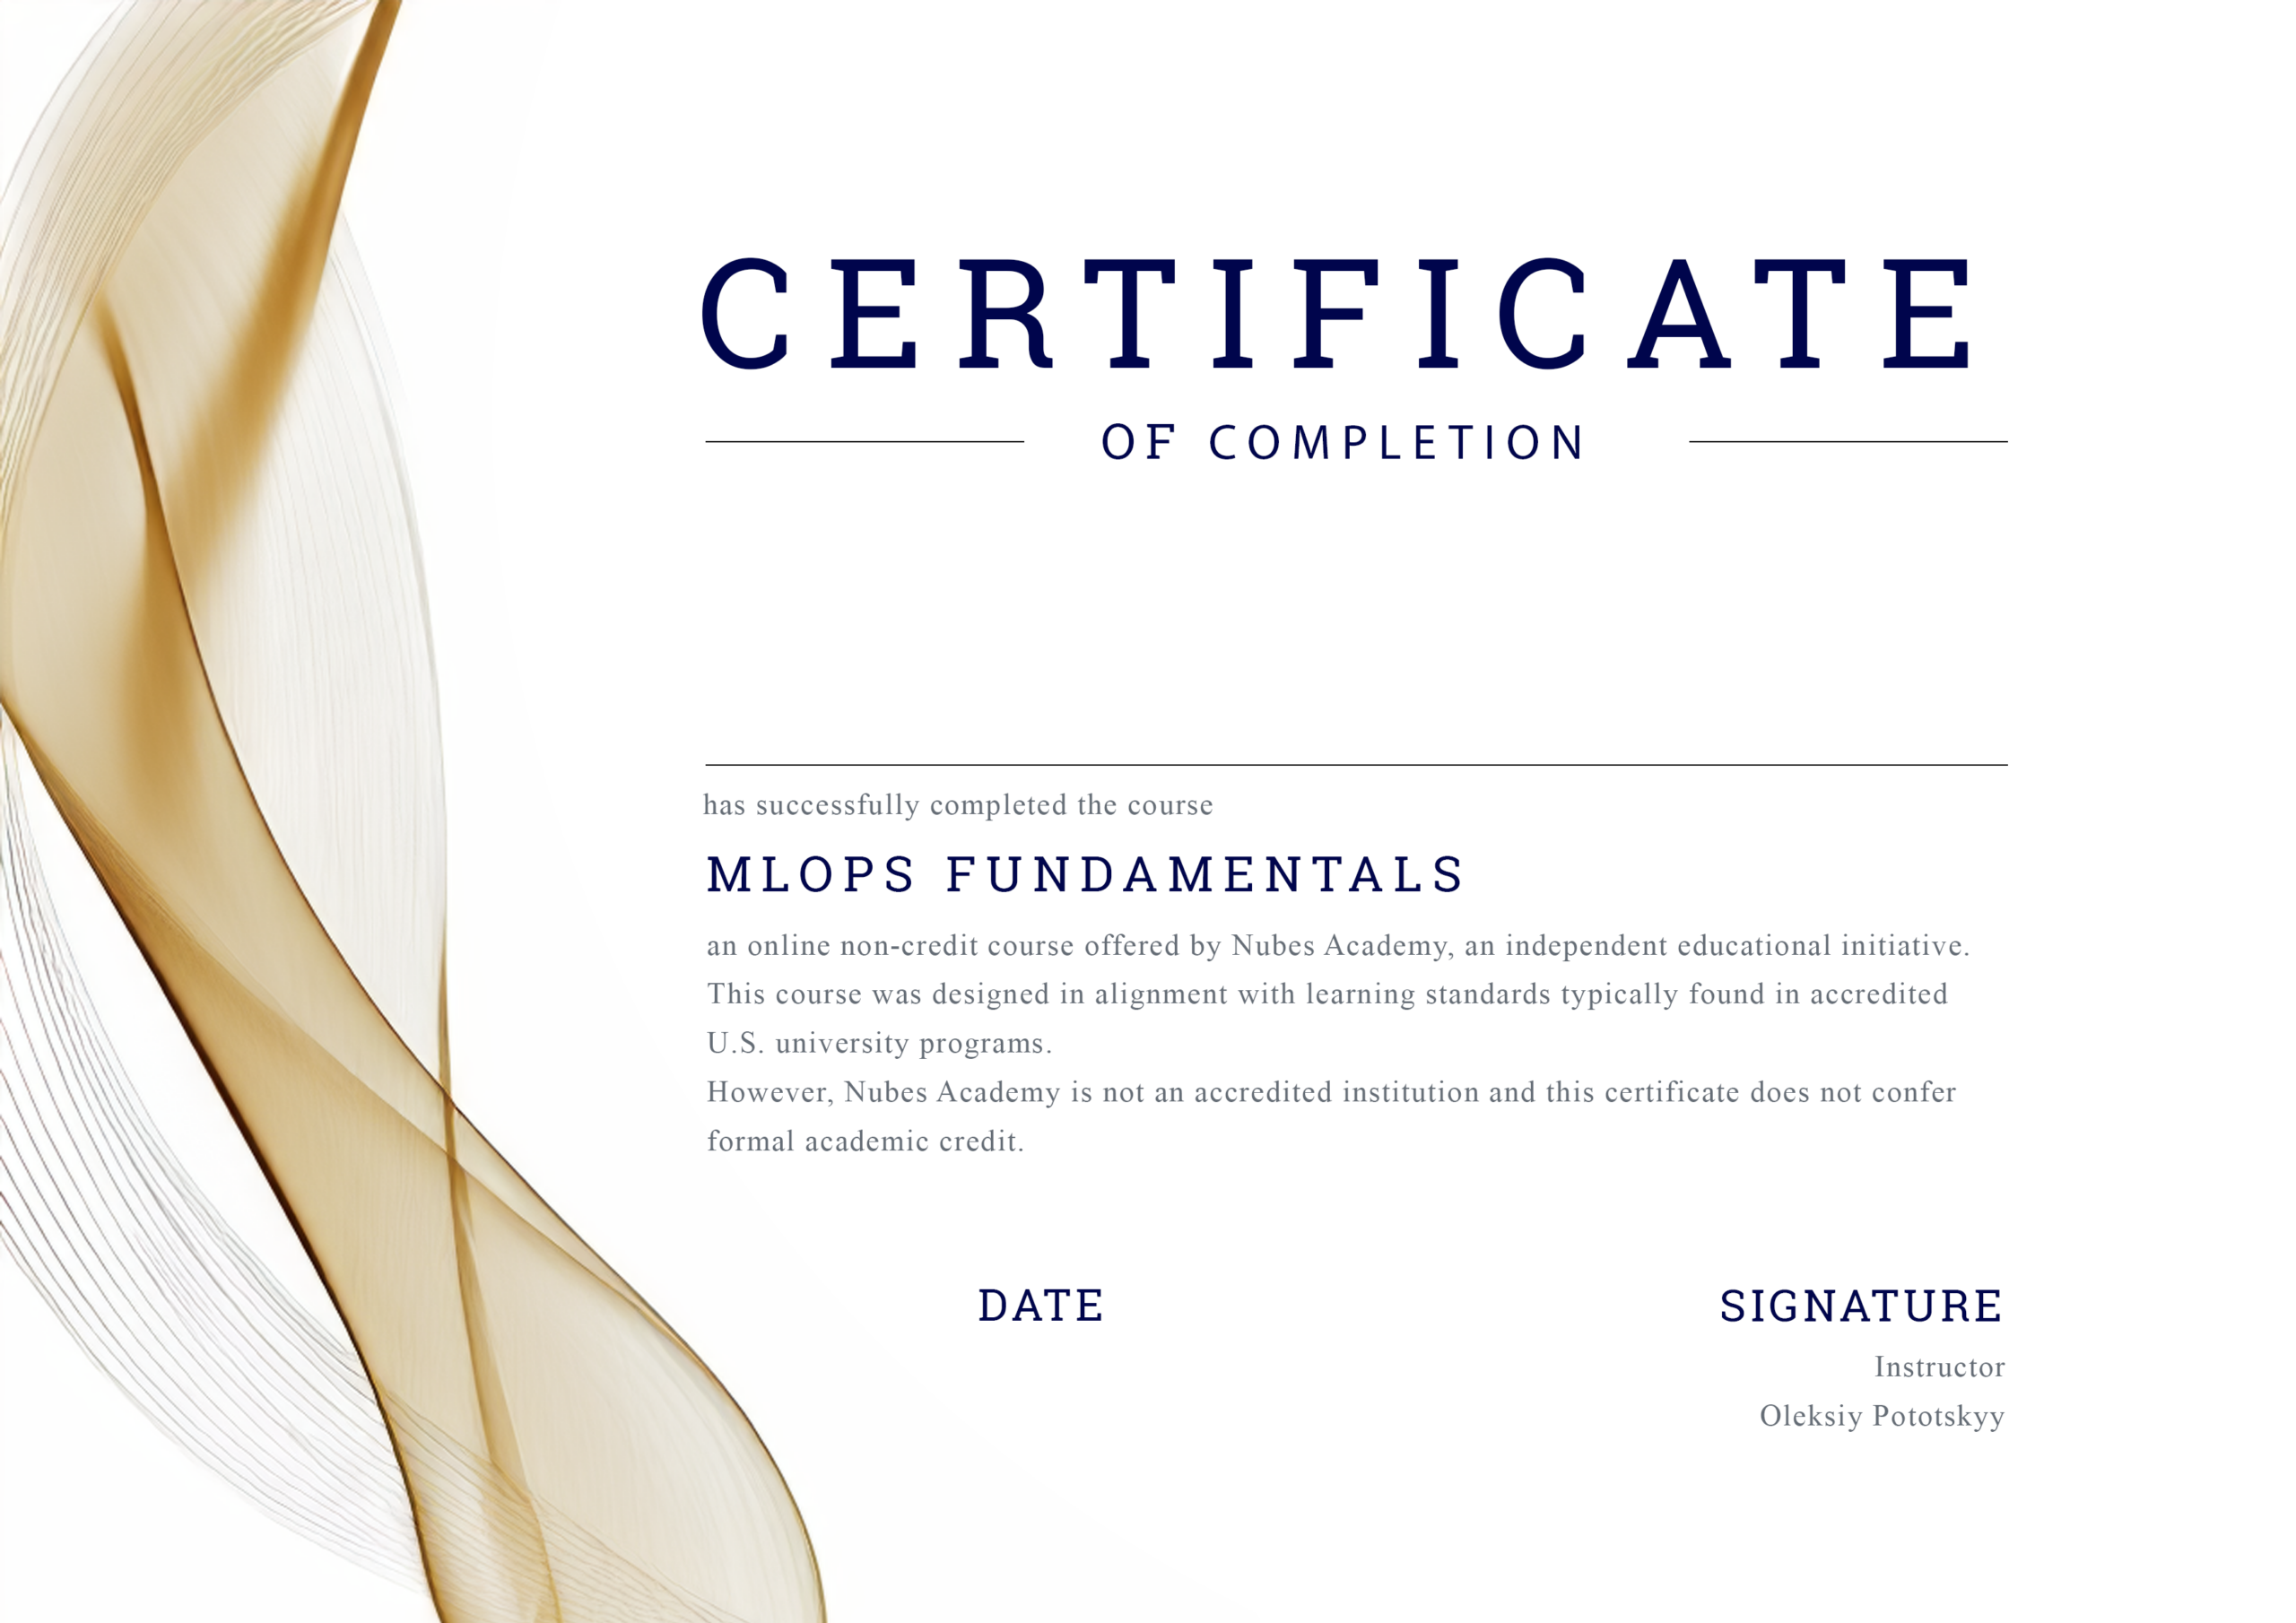
Machine Learning Model Lifecycle — Certificate of Completion

Course credential

Certificate of Completion

Complete the course and earn a Certificate of Completion in MLOps Observability & Monitoring — shareable directly to your LinkedIn profile and CV. Production ML observability — covering model quality monitoring, drift detection, and LLM-specific signals — is one of the most in-demand senior MLOps skills and a credible differentiator in technical hiring.

This certificate is Step 7 of the MLOps Specialization. Nubes Academy is developing university accreditation partnerships for the full specialization — the credentials you build today are designed to grow into something recognized beyond a standard online course certificate.

🎓 Part of the MLOps Specialization path Complete all courses in the specialization to qualify for the full Specialization Certificate — designed toward university accreditation.
Alex Pototskyy - Founder, Nubes Academy

Your instructor

About Your Instructor

Alex is an Independent Consultant with 20+ years of experience across Software development, DevOps, Architecture, and technical leadership. He developed and delivered Cloud & DevOps curriculum at Master’s Degree level at a university, and continues to work as an active practitioner alongside building Nubes Academy.

What makes Alex’s approach different: his courses are built from data, not assumptions. The MLOps Fundamentals curriculum was designed by analysing what MLOps engineers actually do in production, not by following a generic textbook outline. The result is a course that covers what your future employer expects, explained in a way that makes sense if you already think like an engineer.

If you have a background in IT, and you want to understand where ML fits into the systems you already work with – this course was built for exactly where you are.


Got questions?

Frequently asked questions

The course is currently in development. Join the waitlist to be notified as soon as it’s available — waitlist members receive subscriber pricing at launch. We don’t publish a date until the course passes our quality review.
The infrastructure monitoring patterns — latency dashboards, error rate alerts, Prometheus scrape configs — will be familiar. The new material starts with Module 2: ML-specific signal design, prediction distribution tracking, drift detection jobs, online evaluation feedback loops, and SLOs for prediction quality rather than just service availability. The telemetry design module (Module 4) on cardinality, correlation IDs, and PII-safe logging will also cover ML-specific concerns that standard Prometheus/Grafana courses don’t address.
Yes — dedicated modules for each. Module 5 covers instrumentation for online serving (FastAPI/KServe), and Module 6 covers batch pipeline metrics (freshness, completeness, success ratio) and streaming signals (consumer lag, dead-letter queue counts). The running project includes both a Churn API (online) and a Batch Scoring pipeline, so you instrument both in the lab exercises.
The running project is the Churn API + Batch Scoring system (consistent with earlier courses in the specialization) extended with a small LLM/RAG endpoint. This endpoint is used specifically in the LLM observability module (Module 16) and the LLM RAG staleness post-mortem (Module 17), giving you a concrete target to apply LLM-specific SLIs, RAG freshness monitoring, and quality probe comparisons. It’s a small addition — not the primary focus of the course — but it makes the LLM observability content practical rather than theoretical.
Module 17 (Case Studies & Post-Mortems) presents three realistic ML production incidents: a schema change upstream that silently broke features, a concept drift event triggered by a promotional campaign, and an LLM RAG index that wasn’t refreshed and started serving stale results. For each incident, the module walks through how it would be detected using the observability stack built in earlier modules, diagnosed, and resolved. You then write a structured post-mortem — following the standard format (timeline, root cause, impact, action items) — as the module deliverable.
Course #6 (Data for MLOps) teaches you to build and manage the data layer — ingestion, validation, feature stores, versioning. This course (Course #7) teaches you to observe and monitor that layer in production — data freshness signals, completeness metrics, schema change rate, and drift detection. The courses are complementary: Course #6 gives you a well-managed data layer; this course gives you the visibility to know when that layer is healthy or failing.
Yes — you’ll receive a Certificate of Completion in MLOps Observability & Monitoring shareable on LinkedIn and your CV. This is Step 7 of the MLOps Specialization. Nubes Academy is developing university accreditation partnerships — the full specialization certificate is designed to qualify as a recognized credential beyond a standard online course.
Yes. Team licenses for 5–20 engineers will be available, with a manager progress dashboard and kickoff session. This course is particularly effective for on-call teams — when everyone shares the same observability vocabulary, SLO definitions, alert configurations, and post-mortem format, incident response becomes significantly faster and more consistent. Contact [email protected] to be included in early team pricing discussions.

Still have questions? Email us directly — we reply within 1–2 business days.

It’s not just skills. It’s your next chapter.

Stay ahead

New courses.
Better price.
Subscribers first.

  • Subscriber-only discount on every new course in the MLOps Specialization – before public launch price applies
  • Early access to new courses when they go live.
  • MLOps job market insights – what skills employers are actually hiring for, based on real job description data
  • Practical guides & free content – no noise, only what matters for engineers moving into MLOps

Get early access & subscriber discounts No spam. Unsubscribe any time.

Subscription Form

Your data is stored securely and never shared with third parties.  ·  Privacy Policy